
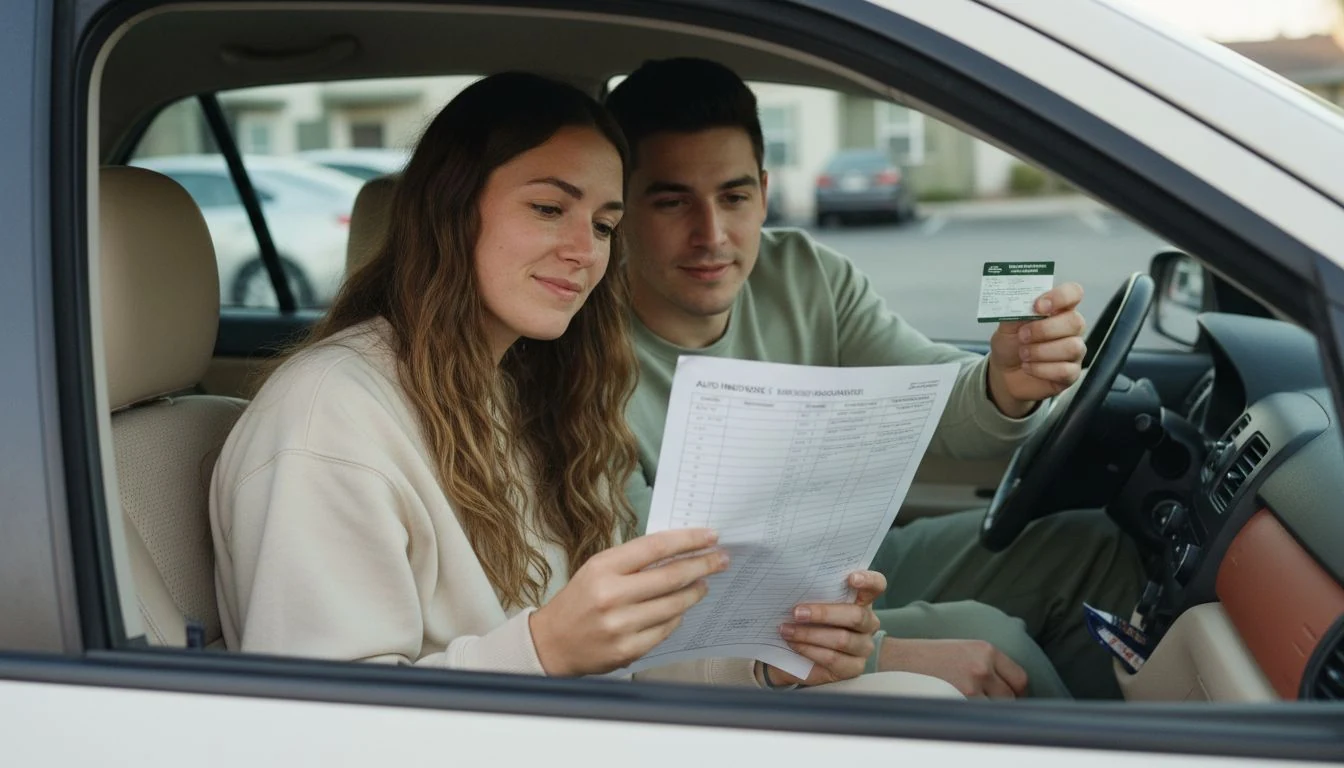
average car insurance cost per month is one of those searches you only make after something has already gone wrong. Mine went wrong on a Tuesday in March, when my renewal notice came in $41 higher than the month before and nobody could tell me why.
I went looking for the real number, from the people who collect it rather than the sites that want to sell you a quote. What I found surprised me, and for once it is good news. Your bill will still look nothing like the average, and I will get to why, along with how I finally stopped letting this line ambush me twice a year.
The average car insurance cost per month, and where the number comes from
The most credible figure available comes from the National Association of Insurance Commissioners, the body the state insurance regulators run themselves. Their Auto Insurance Database Report puts the countrywide average expenditure at $1,281 per year, which is $106.75 a month. The median state came in lower, at $1,114 a year, or about $93 a month.
Two things about that number matter more than the number itself.
First, “expenditure” there means what drivers spent, across everybody. Some of those people carry state-minimum liability and nothing else. If you carry collision and comprehensive too, the comparable figure is the combined average premium, and that one is $1,438 a year, or roughly $120 a month.
Second, and this is the part almost nobody mentions: that report is built on 2023 data. It was adopted in December 2025. Regulatory data is slow, and anyone quoting you a precise 2026 average is guessing, usually from inside their own quote funnel.
Trending the NAIC number forward with the federal price index for motor vehicle insurance gets you to roughly $126 a month for typical coverage, and about $142 a month if you carry full coverage. That is my arithmetic, not the NAIC’s. I would rather show you the math than hand you a confident figure I made up.
The average car insurance cost per month is actually falling right now
I did not expect this part.
The Bureau of Labor Statistics tracks motor vehicle insurance as its own line inside the Consumer Price Index. I pulled the series today. In August 2026 the index sat at 848.2. A year earlier it was 894.1.
That is a 5.1% drop, year over year. Car insurance prices are falling, and they have been sliding since February. It is the first real decline since 2020, when nobody was driving and insurers handed back refunds.
You have to know what came before it to see why that matters. Prices rose 17.4% in 2023. Then another 17.8% in 2024. Then 6% in 2025. Three years of that stacked on top of each other is how a bill that used to be $95 quietly became $150, and why so many people assume they are being singled out. You weren’t. Everyone got hit.
I spent two years assuming my insurance kept climbing because of something I did. It was climbing because repair costs were climbing, and I could not have driven my way out of it.
What a decline means practically: this is the first year in a while where shopping your policy might land you somewhere better, because insurers are competing again instead of repricing everyone upward.
Why your quote looks nothing like the average
Averages hide an enormous amount here, more than with almost any other bill I have written about on the budgeting side of this blog.
The inputs that move your premium most:
- Where you park it overnight. Not your state. Your zip code. Two neighborhoods twenty minutes apart can differ by 40% on identical drivers.
- Your coverage level. State-minimum liability versus full coverage is often a 2x difference by itself, and it is the biggest lever you control.
- The car. Repair cost drives this now more than theft does. A car with sensors in the bumper costs more to fix after a parking lot tap than my old sedan cost to fix after anything.
- Your claim history. One at-fault claim follows you three to five years in most states.
- Credit-based insurance score, in the states that allow it. California, Hawaii, Massachusetts and Michigan restrict or ban it. Most others don’t.
Notice what is barely on that list: how carefully you drive day to day. Safe driving keeps claims off your record, and that matters over years. It does very little for the quote you get next month.
Your state moves the number more than your driving record does
The state spread in the NAIC data is wider than most people assume. Same coverage, same year, wildly different bills:
- Florida, highest in the country at $1,865 a year, about $155 a month
- Louisiana at $1,754, roughly $146 a month
- New York at $1,753, effectively tied with Louisiana
- North Dakota, the lowest, at $808 a year, about $67 a month
- Maine at $856 and Idaho at $864, both under $72 a month
A driver in Florida pays more than twice what a driver in North Dakota pays, and neither of them chose that. It comes out of litigation climate, storm exposure, uninsured driver rates and traffic density. No personal-finance tip fixes it.
Which is why I stopped treating this as a number to optimize and started treating it as a number to plan around.
What I pay, and the month mine jumped $41
I pay $137 a month for full coverage on a 2018 sedan, in a mid-size city, with no claims. That is above the national average and I have made peace with it.
The March jump was $41. I called, sat on hold for nineteen minutes, and got told it was a “rate adjustment for my rating territory.” No accident, no ticket, nothing changed on my end. I switched carriers two months later and landed at $137, which was $18 below where I had been before the increase.
My own expensive mistake, in case it saves you the same money: for about a year and a half I paid monthly with an installment fee of $6 baked in, and I never once noticed it. That is $72 a year for the privilege of splitting the bill. When I switched I paid the six-month term in full out of a sinking fund, and the effective cost dropped again.
The sinking fund is the whole trick, honestly. I lay out the categories I use in my sinking fund breakdown, and car insurance is the one that changed the most for me. Paying in full is usually a 5% to 10% discount plus the dropped installment fees, and the only reason most of us pay monthly is that we don’t have the lump sitting there in February.
Budgeting for the average car insurance cost per month
Six steps that turned the average car insurance cost per month into a line I stopped thinking about. Step three is the one people skip.
- Find your real annual number, not your monthly one. Pull your declarations page and look at the six-month premium. Double it. That is the figure that belongs in your yearly plan.
- Divide by twelve and give it its own line. Mine is $137. Yours might be $93 or $160. The point is that it becomes a fixed cost with a name, not a surprise.
- Add 8% on top and park it. Nobody does this step. Renewals move. A cushion means a rate adjustment is annoying instead of destabilizing, and if prices keep falling the way they are right now, you end the year with money left over.
- Switch to paying the term in full once the fund covers it. Takes about six months to build. Worth it for the discount alone.
- Re-quote once a year, in the same month every year. Put it on the calendar so it is a chore instead of a crisis. Do it right before renewal, while you still have room to walk.
- Check your deductible against your emergency fund, not against the premium. A $1,000 deductible only saves you money if you actually have $1,000 sitting there. If you don’t, that is a different emergency fund conversation first.
My honest opinion, and it is not the popular one: the “shop around every six months and save $500” advice is mostly written by people who earn a commission when you request a quote. Shopping once a year is plenty. Budgeting for the number every month is what stops it from hurting.
Seven years of car insurance prices, and the mistakes that cost most
I wanted to see the whole arc rather than one year of it, so I ran a worked example. Take a policy that cost exactly $100 a month in 2019 and move it with the federal motor vehicle insurance index. Same policy, same driver, only the market price changing underneath:
| Year | Price index | Change | A $100/month 2019 policy becomes |
|---|---|---|---|
| 2019 | 571.0 | baseline | $100.00 |
| 2020 | 544.6 | -4.6% | $95.38 |
| 2021 | 565.3 | +3.8% | $99.00 |
| 2022 | 609.8 | +7.9% | $106.80 |
| 2023 | 716.0 | +17.4% | $125.39 |
| 2024 | 843.1 | +17.8% | $147.65 |
| 2025 | 893.5 | +6.0% | $156.48 |
| Aug 2026 | 848.2 | -5.1% | $148.55 |
Two things jump out. A policy that felt manageable in 2021 costs about half again as much today, which is why this line wrecks older budgets. And the last row is the first time in six years the number moved down.
Three mistakes that cost the most
- Paying monthly without checking the installment fee. Mine was $6 a month and invisible on the statement. Across two cars and four years that is real money for nothing at all.
- Dropping to state minimum to fix a budget problem. It works for exactly as long as nothing happens. Minimum liability in many states won’t cover one moderate hospital bill, and you still owe on the car.
- Treating the renewal quote as final. It is an opening number. Mine came down $18 below my pre-increase rate just by moving carriers, and I had assumed for years that switching was a hassle not worth the savings.
Cozy tip: before you touch your coverage, open your last statement and find the installment fee. Then start a car insurance sinking fund with your monthly premium plus 8%, and let it run for six months. That is the whole thing. If you want somewhere to put it, the free monthly budget printable has a fixed-costs section built for exactly this kind of line.
Frequently Asked Questions
What is a normal monthly car insurance payment?
Roughly $93 to $120 a month covers most drivers, based on NAIC data. The median state average works out to about $93 a month, the countrywide average expenditure to $107, and full coverage to around $120. Trended forward to today those sit nearer $110 to $142. Your zip code and coverage level will push you well outside that range in either direction.
Why did my car insurance go up when I didn’t do anything?
Because almost everyone’s did. Motor vehicle insurance prices rose 17.4% in 2023 and another 17.8% in 2024, driven by repair and parts costs rather than individual driving records. Insurers reprice whole rating territories at renewal, so the increase usually is not about you personally.
Is car insurance getting cheaper in 2026?
Yes, modestly. The federal price index for motor vehicle insurance fell 5.1% in the year to August 2026, the first sustained decline since 2020. That drop does not land on your renewal automatically, which is why re-quoting is worth more this year than usual.
How much should I budget for car insurance each month?
Take your six-month premium, double it, divide by twelve, then add about 8% as a cushion for renewal increases. On a $137 monthly premium that is roughly $148 set aside each month. If prices fall, the extra rolls into the next term instead of disappearing.
Does paying car insurance in full actually save money?
Usually, yes. Most carriers offer a pay-in-full discount in the 5% to 10% range, and you also stop paying the per-installment fee, which commonly runs $5 to $10 a month. The obstacle is having the lump sum ready, which is what a sinking fund solves over about six months.
If you want the wider picture of how people are handling money right now, I keep a running set of budgeting statistics updated from the same kind of primary sources I used here. And if the car itself is the bigger line in your budget, the average car payment breakdown is the companion piece to this one. Health coverage is the other fixed bill that reprices itself every year, and I broke down the average monthly cost of health insurance before open enrollment.
Grab my free Monthly Budget Template
The same cozy spreadsheet I use to track every dollar — sinking funds, bills, and savings, all in one place. Join the newsletter and I’ll send it straight to your inbox.
No spam, ever. Unsubscribe anytime. — Nora
Keep reading — more on Budgeting Methods